Server monitor
Description :
-
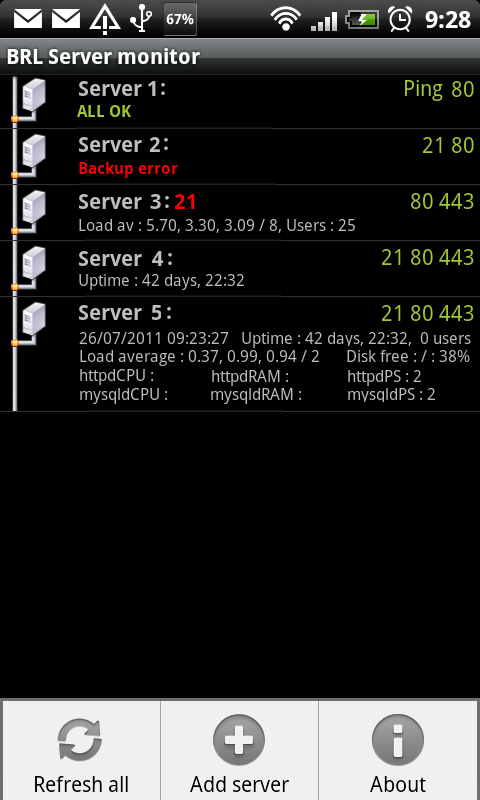
This tool enables you to monitor your servers.
Fonctions :
- check server ping
- check server ports (ex: 21, 80, ...)
- get custom information from servers (ex: Load average)
-
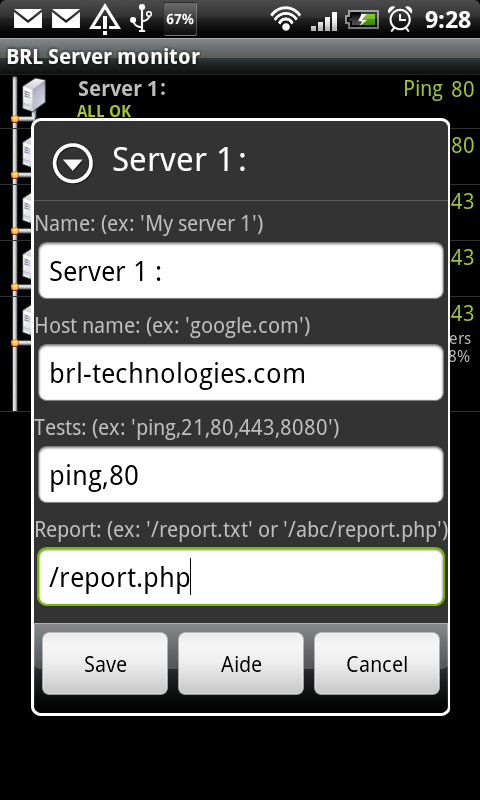
The custom information are got by reading a web file. You can use a text file upgraded by your server or you can use for example a php file.
-
You can color information line starting with one of the following colors: "RED:", "GREEN:", "ORANGE:" or "WHITE:".
Examples with a text file:
- Create script who generate a "report.txt" file.
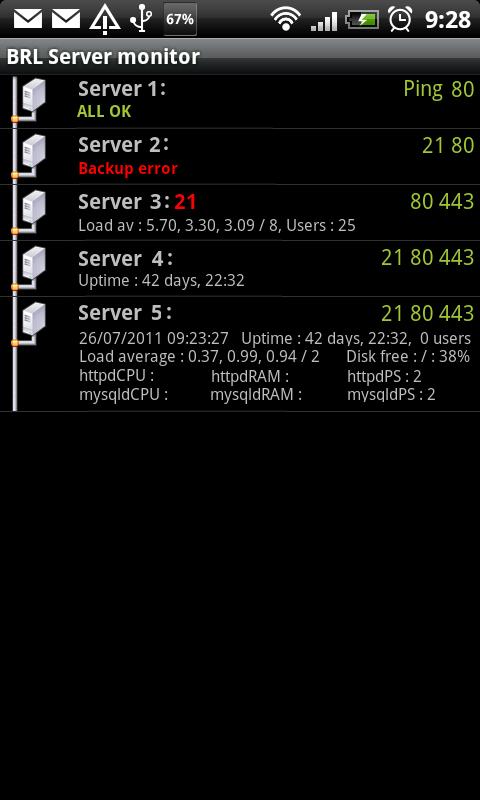
- Exemple of "report.txt" file content : "GREEN:ALL OK" (see the result on screenshot "Server ONE")
- Other example of file content : "RED:Backup error" (see the result on screenshot "Server TWO")
Examples of php file:
- Use this sample file: report.php and uncomment the features you want.
- In this file you have the functions: Hostname, Date system, Uptime, Load average, Apache CPU, Apache RAM, Apache PS, Mysqld CPU, Mysqld RAM, Mysqld PS, Max clients, Disk free.
Screenshots :


